
Introduction
The Crude Column splits raw crude into several product streams that are further processed in other units in the refinery:
- Light naphtha to light ends recovery
- Heavy naphtha to reforming
- Kerosene to hydrotreating
- Distillate (sometimes called diesel) to hydrocracking or hydrotreating
- Atmospheric gasoil (AGO) to cat cracking
- Reduced crude to vacuum distillation
The composition of these streams must be controlled at the Crude Column to prevent operating problems in the downstream units. For example, naphtha must not contain heavy components that would produce excessive coke formation in the reformer unit. Kerosene typically becomes jet fuel which must not contain heavy components that can freeze at high altitude.
The purpose of this post is to describe advanced controls that are often implemented to control the composition of the Crude Column product streams.
Crude Composition
Crude is a mixture of many hydrocarbon components that range from the lightest, methane, to the heaviest, asphalt. This mixture is extremely difficult to characterize by individual component analysis. The best way to characterize the crude is to plot the boiling point vs. percent volume distilled from the crude assay. Figure 1 is a typical plot.
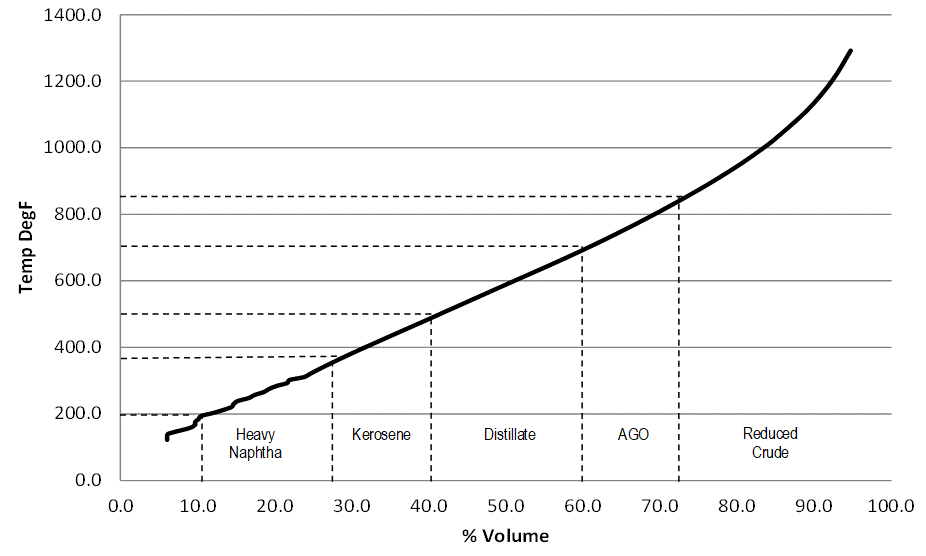
Figure 1: Crude Assay Plot
Crude Distillation
Crude distillation splits the crude up into the product streams listed in the Introduction above. Each product has a specification for maximum boiling point (typical end points indicated in parentheses):
- Light naphtha (200)
- Heavy naphtha (380)
- Kerosene (500)
- Distillate (700)
- AGO (850)
The product cuts defined by the temperatures indicated above are superimposed on the crude assay plot in Figure 1. Note that the product yield (distance between dashed lines on X axis) is determined by the end point (EP) specification. Therefore, adjusting the product yield can shift the EPs significantly.
Crude Product Separation
Product separation in a Crude Column is not as good as implied by the product cuts shown in Figure 1. The product distillation curves will have tails on each end as shown in Figure 2 (heavy dashed curves). The tails cause the product yields to shift considerably in order to meet the EP specifications. For example, the yield of all products lighter than reduced crude declines by 4-5% when poor separation is taken into account. Obviously, improving separation allows for a greater yield of desirable products.
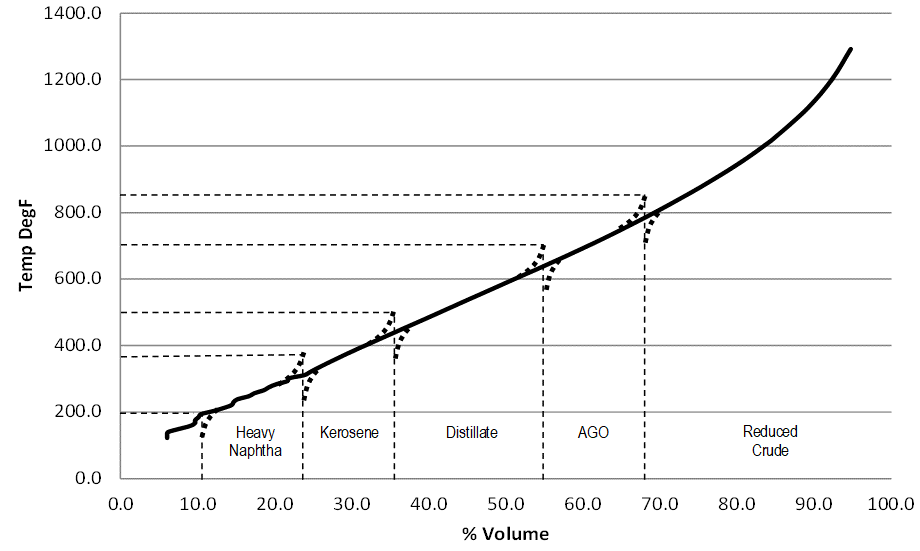
Figure 2: Product Distillations Superimposed on Crude Assay Plot
Overhead System
The Crude Column overhead system partially condenses the vapor from the tower overhead and separates the resulting liquid from the offgas in the overhead receiver. The offgas is compressed and then sent to the light ends recovery unit. A portion of the liquid is returned to the tower as reflux, and the remainder is the naphtha product. Figure 3 shows the typical overhead system described above.
Some Crude Columns have a heavy naphtha sidedraw product and draw off the overhead liquid product as light naphtha. Other overhead systems employ two sets of condensers and receivers, one for condensing only the reflux and the other for condensing the overhead product. This discussion assumes that the entire naphtha product stream comes from a single overhead receiver.
Basic Controls Overhead System
Figure 3 also shows the basic controls for the overhead system. The Crude Column overhead temperature is a good indicator of naphtha product EP, so it is controlled by adjusting the setpoint of the reflux flow controller. The overhead pressure is controlled by releasing offgas from the receiver. The receiver level is controlled by adjusting the setpoint of the naphtha product flow controller. The cascades to the reflux and naphtha flow controllers are recommended because the advanced controls discussed later depend on these flow controllers.
It is important from the standpoint of naphtha EP control that the pressure near the temperature sensor be controlled. The naphtha EP is affected significantly by changes in pressure.
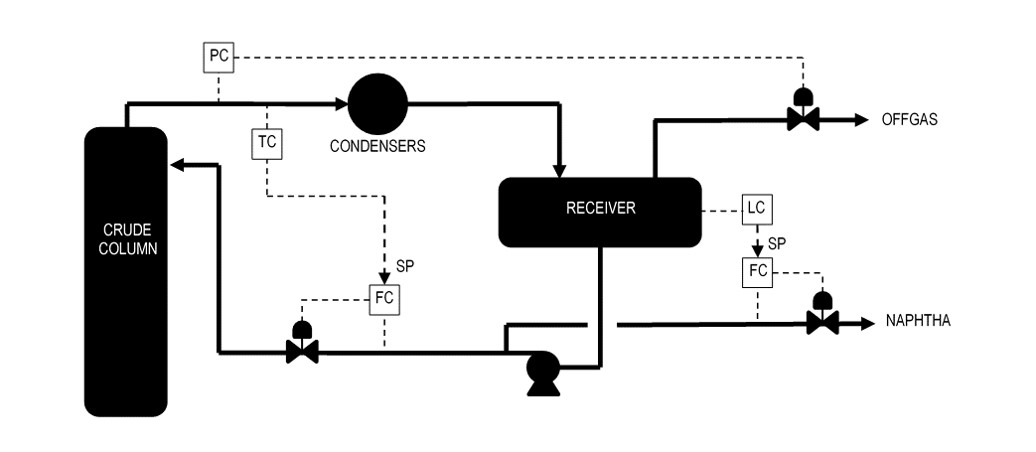
Figure 3: Typical Crude Tower Overhead System
Sidedraw Product Stripping System
Kerosene, distillate, and AGO product streams are drawn off as sidedraws from the Crude Column. Sidedraw products are often stripped to remove light components from the product, thus increasing its initial boiling point (IBP). Superheated steam is usually employed to perform the stripping. However, kerosene usually has a moisture spec, so a reboiler is used instead. Figure 4 shows the typical sidedraw product stripping system.
The stripper level adjusts the flow from the draw tray, with the product flow from the stripper on flow control. The product flow controller setpoint is adjusted to control product EP. The steam should be on flow control and adjusted to control product IBP, or flash point.
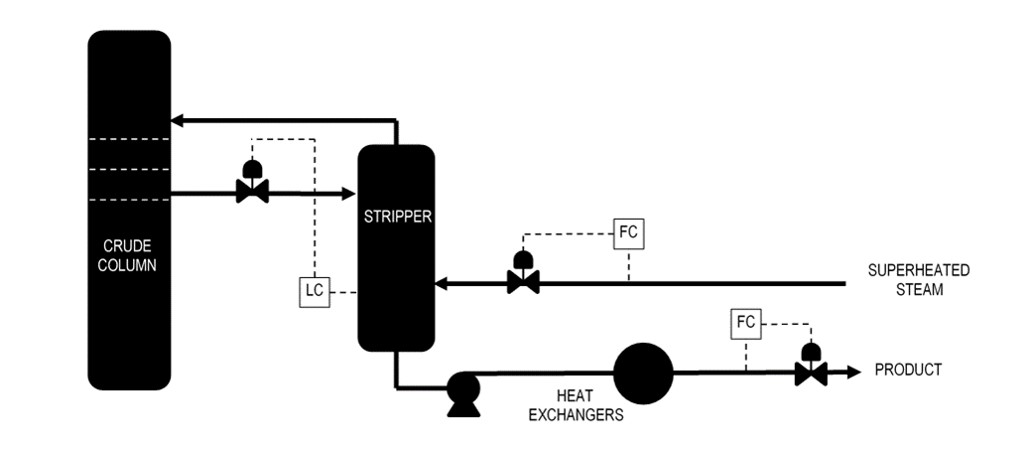
Figure 4: Typical Sidedraw Product Stripping System
Sidedraw Total Draw Tray
The sidedraw system shown in Figure 4 is an example of a partial product draw. Some of the liquid entering the draw tray flows to the stripper while the remainder flows down to the next lower tray in the column. However, the draw tray can also be a total (trap-out) draw pan. In this case, all of the liquid entering the tray is drawn out of the column and then divided into pump-back return and product streams.
The draw pan level should be controlled by adjusting the pump-back flow. This makes the total draw design the same as the partial draw, in that whatever liquid is not sent to the stripper continues down the column as internal reflux. The remaining controls are the same as for a partial draw. Figure 5 shows the total draw controls.
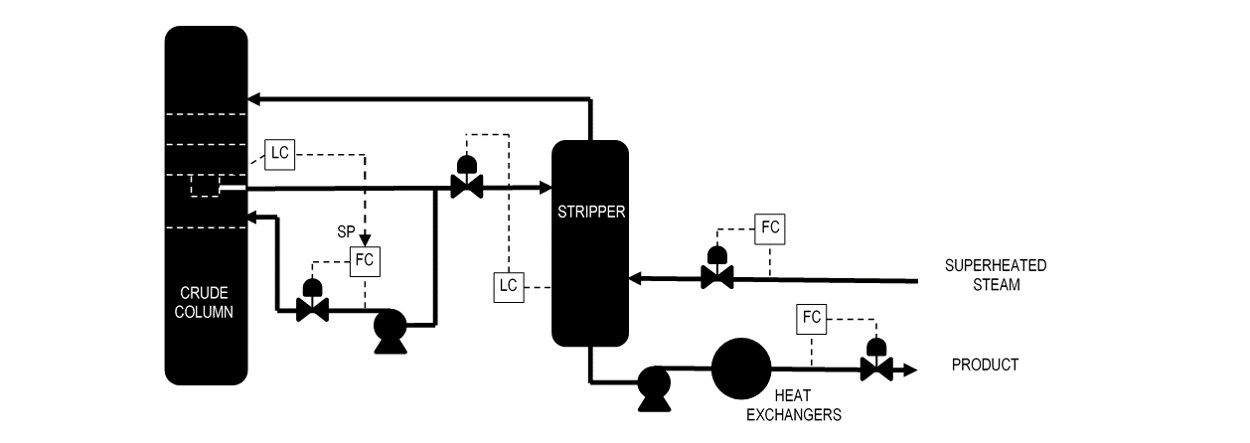
Figure 5: Sidedraw Total Draw Controls
Product Separation
As discussed earlier, the tails in Figure 2 are caused by incomplete product separation. The degree of separation between two adjacent product streams, light and heavy, can be indicated by the overlap, which is defined below in terms of the product distillations:
Overlap = Light_EP – Heavy_IBP
IBP is the temperature at which the first molecule of the sample vaporizes. Similarly, EP is the temperature at which the last molecule of the sample vaporizes. Both of these values are subject to measurement errors, more so than the other distillation points. Therefore, the 5% point is often substituted for IBP and the 95% point for the EP.
Overlap = Light_95% – Heavy_5%
Separation is a function of the number of trays between products and the L/V for this section of the column. L is the liquid rate going down the column and V is the vapor rate going up the column. The number of trays is fixed by the column design, so the only way to vary the separation is by varying the L/V. The vapor rate is primarily determined by the crude charge rate and the vaporization in the crude heater, so it cannot be varied for separation control. The only manipulated variable remaining is the liquid rate.
Liquid is obtained by condensing the vapor in the overhead condensers and in the pumparound sections at several locations in the column. Condensation requires heat removal, which is usually accomplished by pre-heating the crude charge. The overhead temperature is much lower than temperatures in the product sections below, so heat transfer is limited in the overhead. Therefore, pumparounds are used as contact condensers in the column to augment overhead condensation. The higher temperatures further down in the column improve heat recovery.
Pumparounds
Pumparound circuits usually correspond to product sidedraws, but not all sidedraws have associated pumparounds. A portion of the sidedraw is pumped to crude vs. pumparound exchangers and then injected back into the column several trays above the draw tray (but below the stripper vapor return). These trays serve as contact condensers in which the cold pumparound liquid condenses some of the vapor (see Figure 6). The resulting liquid becomes internal reflux (L) below the draw tray.
Therefore, separation between two products can be controlled by adjusting the pumparound flow above the lighter product draw. Note that increasing a pumparound heat removal will result in a corresponding decrease in overhead condenser heat removal. So increasing L below the pumparound will decrease L above the pumparound.

Figure 6: Pumparound Circuit
Advanced Applications
Crude Column product composition controls are greatly enhanced by employing advanced control. Advanced control can help with the long lags and deadtimes in the response of composition to the various manipulated variables. Advanced control also can be used to infer product composition from process inputs, such as column pressure and tray temperatures. Typical advanced applications are:
- Advanced overhead control
- Product yield control
- Stripping steam ratio control
- Inferred product composition control
These applications are discussed in detail in the remainder of this document.
Advanced Overhead Control
Overhead temperature control and receiver level control interact because the reflux flow and the naphtha product flow both affect the level. With advanced overhead control implemented, the temperature controller adjusts both the reflux and the product flows the same amount but in opposite directions. The net flow change is zero so the level is unaffected by temperature control.
The level controller also adjusts both the reflux and product flows, but it maintains the ratio of reflux-to-product that the temperature controller established. The control action is designed to prevent a change to the overhead temperature due to level control.
Feedforward control is also implemented in the advanced overhead control scheme. Changes in crude charge rate will affect both the temperature and the level. Therefore, the reflux and the product flows are adjusted in proportion to the crude charge rate change. Just like the level controller, the feedforward adjustment is done while maintaining the ratio of reflux-to-product constant.
See Figure 7 for an illustration of the advanced overhead control scheme.
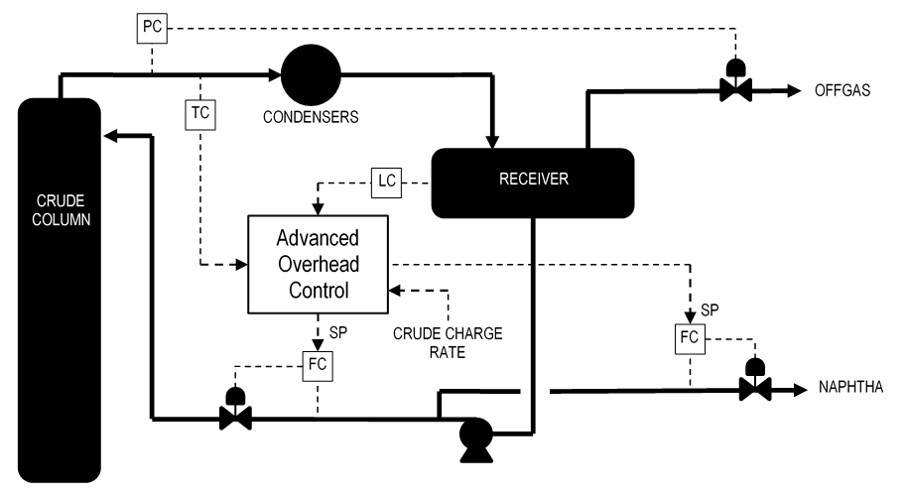
Figure 7: Advanced Overhead Control
Product Yield Control
Figures 1 and 2 show the dependency of product EP and product yield. Therefore, controlling product yield is an important first step in controlling product composition.
Yield is the percentage of the crude charge rate that the product flow represents. For example, if the crude rate is 50 MBPD and the product rate is 10 MBPD then the yield is 20% (= 100 * 10 / 50).
The operator can adjust the yield setpoint to control product EP, or the setpoint can be automatically adjusted by the inferred product EP advanced controller. Whenever the product rate is changed, a corresponding change is made to the draw valve. This feedforward action helps to maintain the stripper level, but more importantly, it speeds up the response of the product composition to a change in product rate.
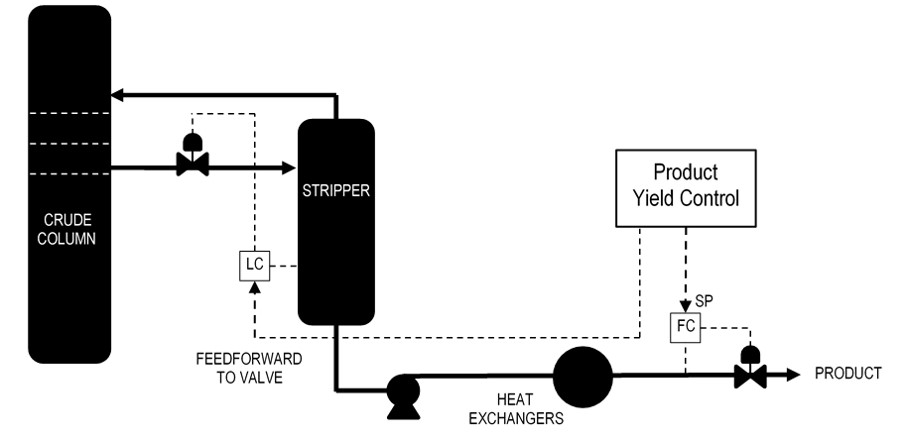
Figure 8: Product Yield Control
Stripping Steam Ratio Control
Product yield control, as described above, adjusts the product flow rate. If the stripping steam rate is not adjusted accordingly, the product IBP will vary. Therefore, the stripping steam rate should be adjusted in ratio to the product rate, as shown in Figure 9.
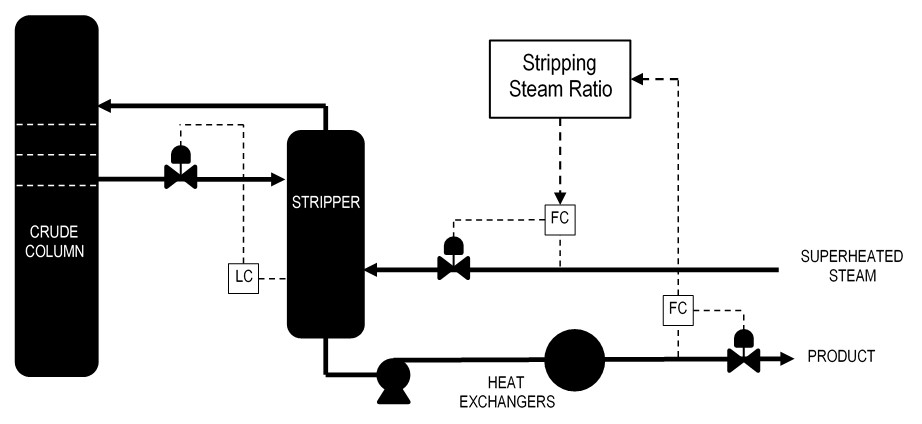
Figure 9: Stripping Steam Ratio Control
Inferred Product Composition Controls
It is possible to infer the following product compositions from key process data:
- Naphtha 95% point
- Kerosene flash point
- Kerosene 95% point (or freeze point)
- Distillate 95% point
The other product compositions are considerably more difficult to consistently infer.
Naphtha 95% Point
Naphtha 95% point can typically be inferred from a linear regression of the following process data:
- Column overhead temperature
- Column overhead pressure
- Reflux-to-charge ratio
It is controlled by adjusting the overhead temperature setpoint.
Kerosene Flash Point (Reboiler)
Kerosene flash point can typically be inferred from a linear regression of the following process data (reboiled stripper):
- Stripper reboiler outlet temperature
- Kero draw temperature
- Column overhead pressure
- Reflux-to-charge ratio
It is controlled by adjusting the kerosene stripper reboiler outlet temperature setpoint. The temperature is controlled by adjusting the flow of the heat source.
Kerosene Flash Point (Steam)
Kerosene flash point can typically be inferred from a linear regression of the following process data (steam stripper):
- Stripping steam-to-product ratio
- Kero draw temperature
- Column overhead pressure
- Reflux-to-charge ratio
It is controlled by adjusting the kerosene stripping steam-to-product ratio setpoint.
Kerosene 95% Point
Kerosene 95% point can typically be inferred from a linear regression of the following process data:
- Distillate draw temperature
- Vapor temperature below the kero draw tray
- Column overhead pressure
- Reflux-to-charge ratio
It is controlled by adjusting the kerosene yield setpoint. The equivalent but opposite (in sign) change is made to the distillate yield to prevent a disturbance to the distillate 95% point.
The kerosene freeze point can be inferred instead of the 95% point, if applicable.
Distillate 95% Point
Distillate 95% point can typically be inferred from a linear regression of the following process data:
- AGO draw temperature
- Vapor temperature below the distillate draw tray
- Column overhead pressure
- Reflux-to-charge ratio
- Pumparound heat removal duty above the distillate draw
It is controlled by adjusting the distillate yield setpoint.
Lab Data Update
Each inferred property correlation can be automatically updated whenever a new lab result is received. The lab update is based upon the difference between the lab result and the inferred property calculation at the time the sample was taken. This difference is called the correlation error. If the correlation is perfect, the error would always be zero.
The lab update can also trigger a regression of the correlation, if this approach is desired. The last five lab results are retained and can be used to recalculate all of the coefficients in the correlation, not just the error term as described above.
Lab Data Checking
The lab data can be manually entered by the operator or it can be automatically entered from the lab data system. In either case, the following data checking steps are taken to protect against entry errors:
- The lab result is checked against absolute high and low limits, which no reasonable lab result should violate. A lab result that violates either absolute limit is ignored.
- The correlation error is limited to a reasonable range. If it is outside this range, only a portion of it is used for the lab update.
- If the correlation error is within a deadband, then the error is assumed to be zero. In this case, the inferred property value is considered to be close enough given the inaccuracy of the lab results.
- If the correlation error is outside of the deadband but within a secondary deadband, then the lab update is suspended until the next result is received. If the next lab result is on the same side of the deadband, then the inferred property value is updated. If the lab result is on the other side of the deadband, but within the secondary deadband, then the update is suspended again until the next lab result is received.
The lab update function includes one final limit on the lab result. The correlation error resulting from the data checking steps listed above is not used in its entirety to update the inferred property correlation. The error is multiplied by a fraction before being added to the inferred property value at the lab sample time.
This fraction is based upon the normal accuracy of the lab results. If the lab is always perfect, then the fraction would be one. That means that the entire error would be added to the inferred property. If the lab is always wrong, then the fraction would be zero, meaning that we would never update the correlation based upon the lab result. The actual fraction used is somewhere in between zero and one, because the lab results are mostly reliable but are prone to some error.
Even after all of this data checking, a bad lab result could get through to the correlation, at least in part. Therefore, the lab update system includes an undo function. If the operator sees a suspicious lab result, he can reject it and the correlation returns to its previous value.